Introduction
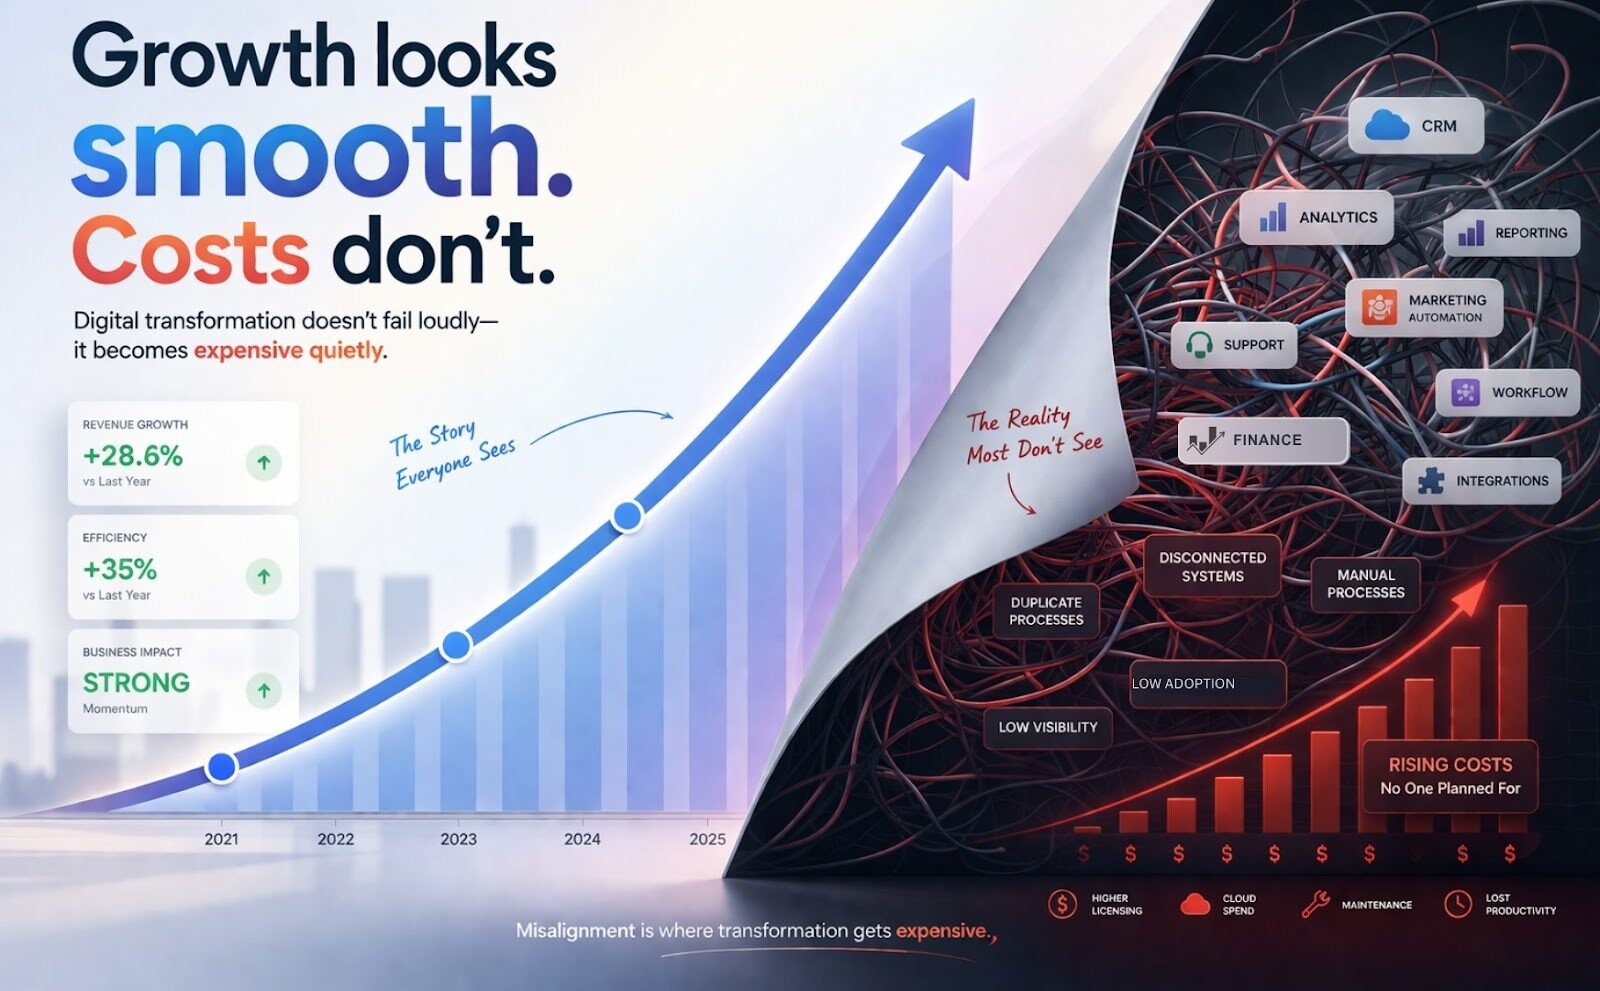
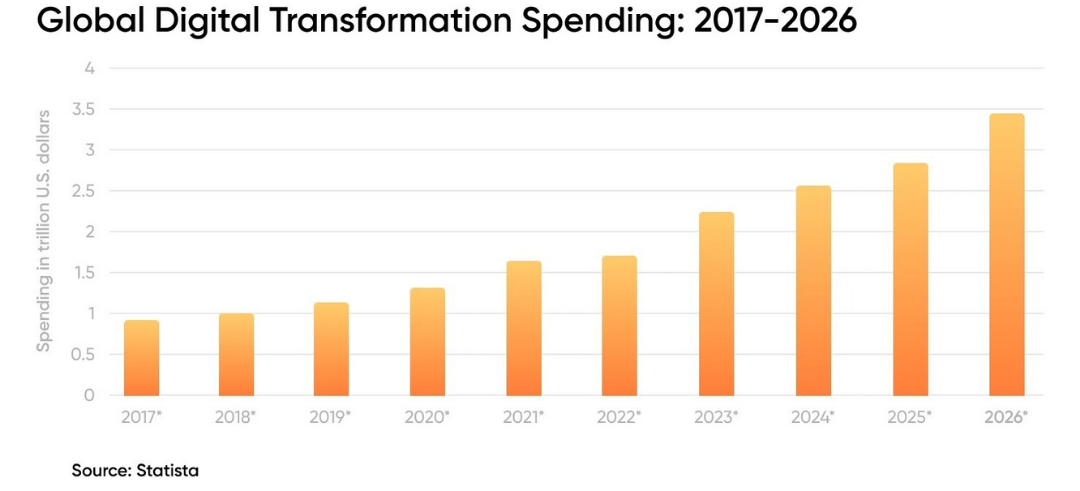
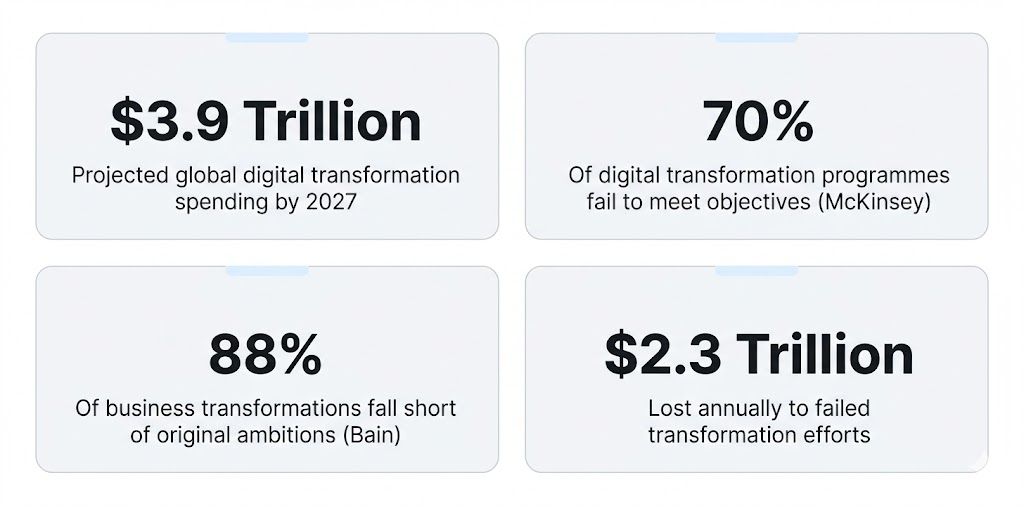
Global digital transformation spending is projected to surpass $3.9 trillion by 2027. Organisations are committing more budget, more leadership attention, and more organisational energy to transformation than at any point in history. And yet, the majority of those initiatives will not deliver the ROI they were designed to produce.
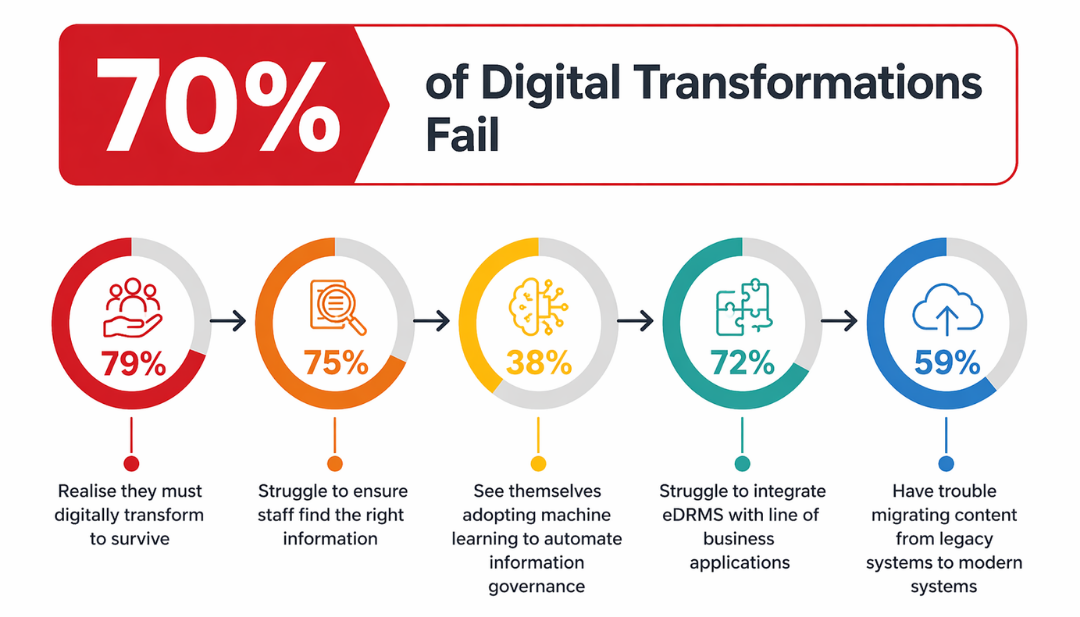
McKinsey reports that 70% of digital transformation programmes still fail to meet their objectives. Bain’s 2024 study puts the figure even higher, 88% of business transformations fall short of their original ambitions. Gartner finds that only 48% of projects fully meet or exceed their targets. Globally, failed transformation efforts cost organisations an estimated $2.3 trillion every year.
The spending is going up. The success rate isn’t keeping pace.
The problem, in most cases, isn’t the technology. It’s the partner.
In 2026, businesses are fundamentally rethinking what makes a consulting relationship valuable. The old model, strategy deck, roadmap handover, exit, is no longer good enough. Organisations have been through that cycle. They know what it produces.
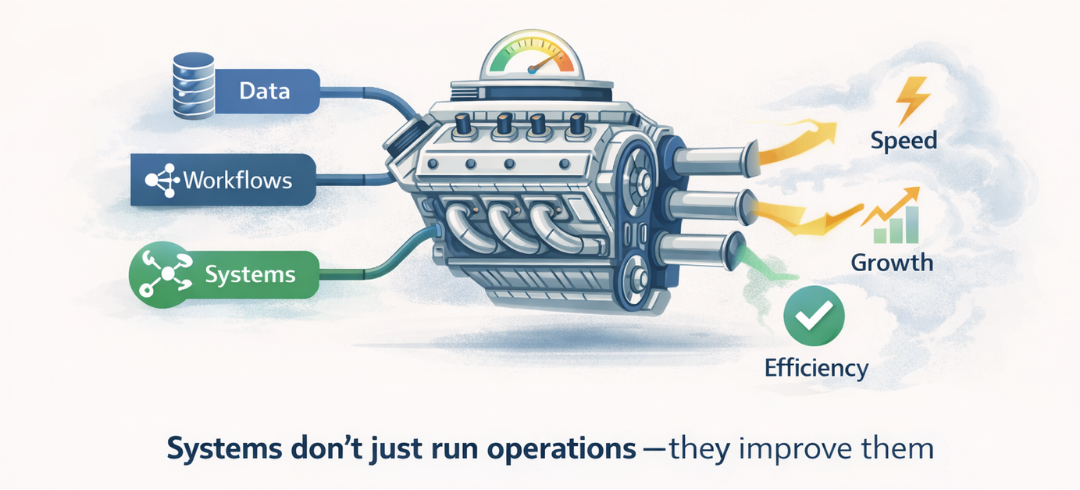
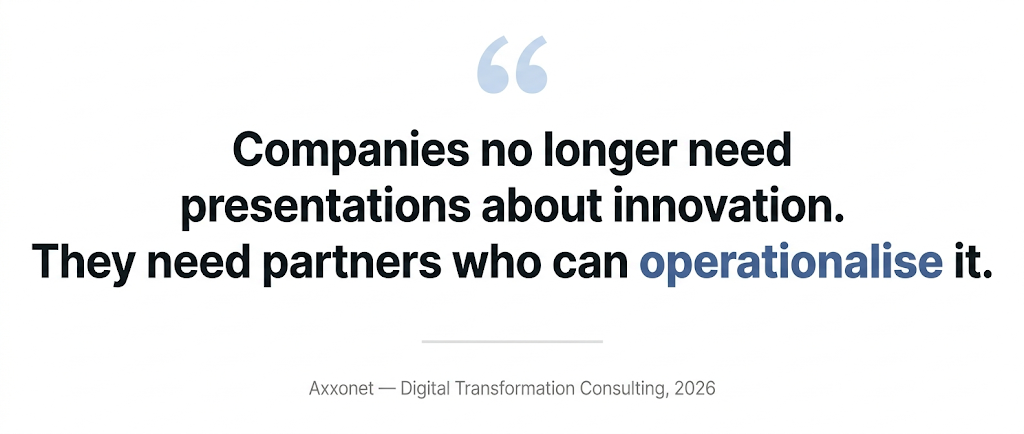
What they need now is different. Companies no longer need presentations about innovation. They need partners who can operationalise it.
This article is a practical guide to finding one.
Why This Decision Is Harder Than It Looks
Most organisations evaluate consulting partners the way they evaluate vendors. Firm size. Client logos. Certifications. A polished proposal, and they still end up with the wrong partner.
Because the things that actually determine whether an engagement succeeds are almost never visible in a proposal. They show up in how a partner asks questions in the first meeting. In whether they push back when your assumptions are wrong. In how they behave when the project hits friction, which it always does.
A firm can have impressive logos and still apply a generic playbook to your context. They can have platform certifications and still not understand your operational realities. They can deliver every milestone on time and still leave your organisation no better equipped than when they started.
The cost of getting this wrong isn’t just financial. A failed engagement sets teams back, burns leadership credibility, and creates the kind of scepticism that makes the next initiative harder to launch, sometimes by years.
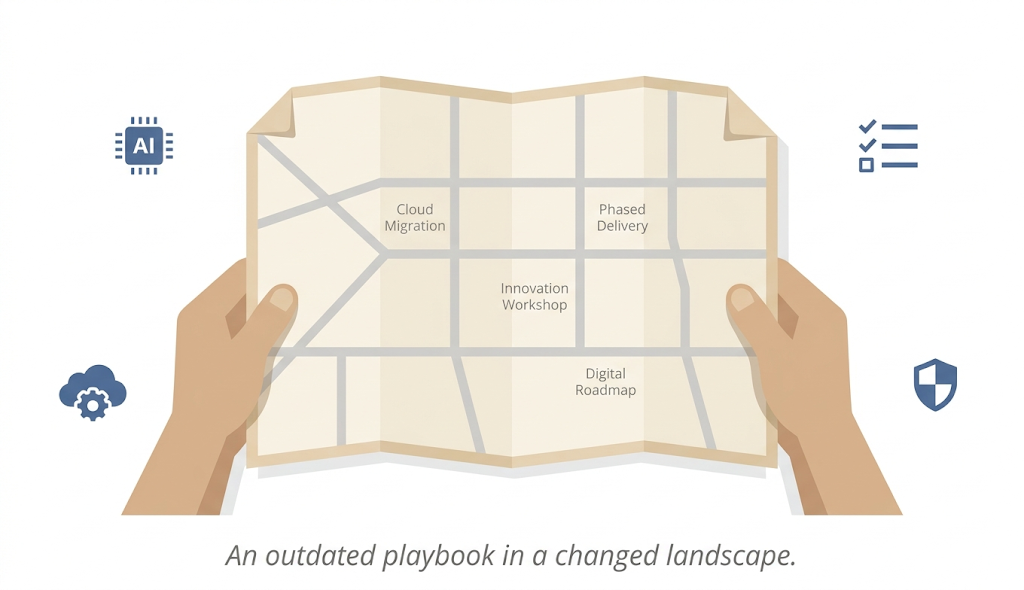
What's Changed About DT Consulting in 2026
The market has shifted. If you last evaluated partners in 2022 or 2023, what you’re walking into now is different.
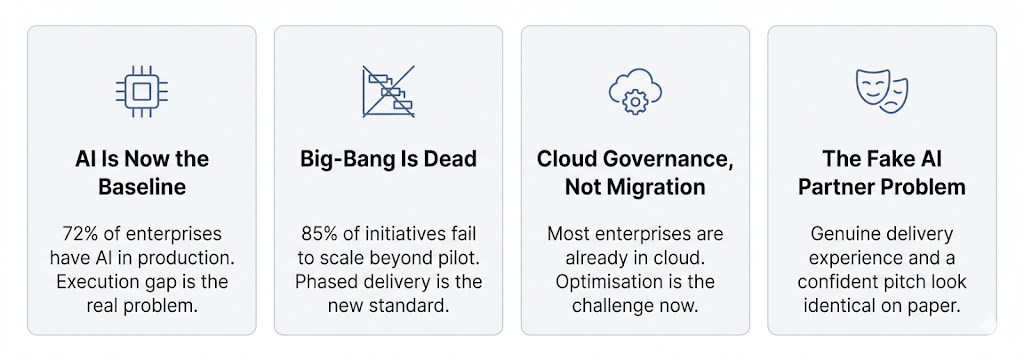
AI is no longer a differentiator, it's a baseline expectation:
Global AI spending surpassed $300 billion in 2026, and according to the reports by IDC 72% of enterprises now report at least one AI deployment in production. But here’s the gap: McKinsey found that over 80% of organisations see no meaningful enterprise-wide impact from their AI investments. The investment is there. The operational results aren’t. That gap exists almost entirely in execution, and it’s what separates partners who understand AI from partners who can deploy it in ways that actually change how a business runs.
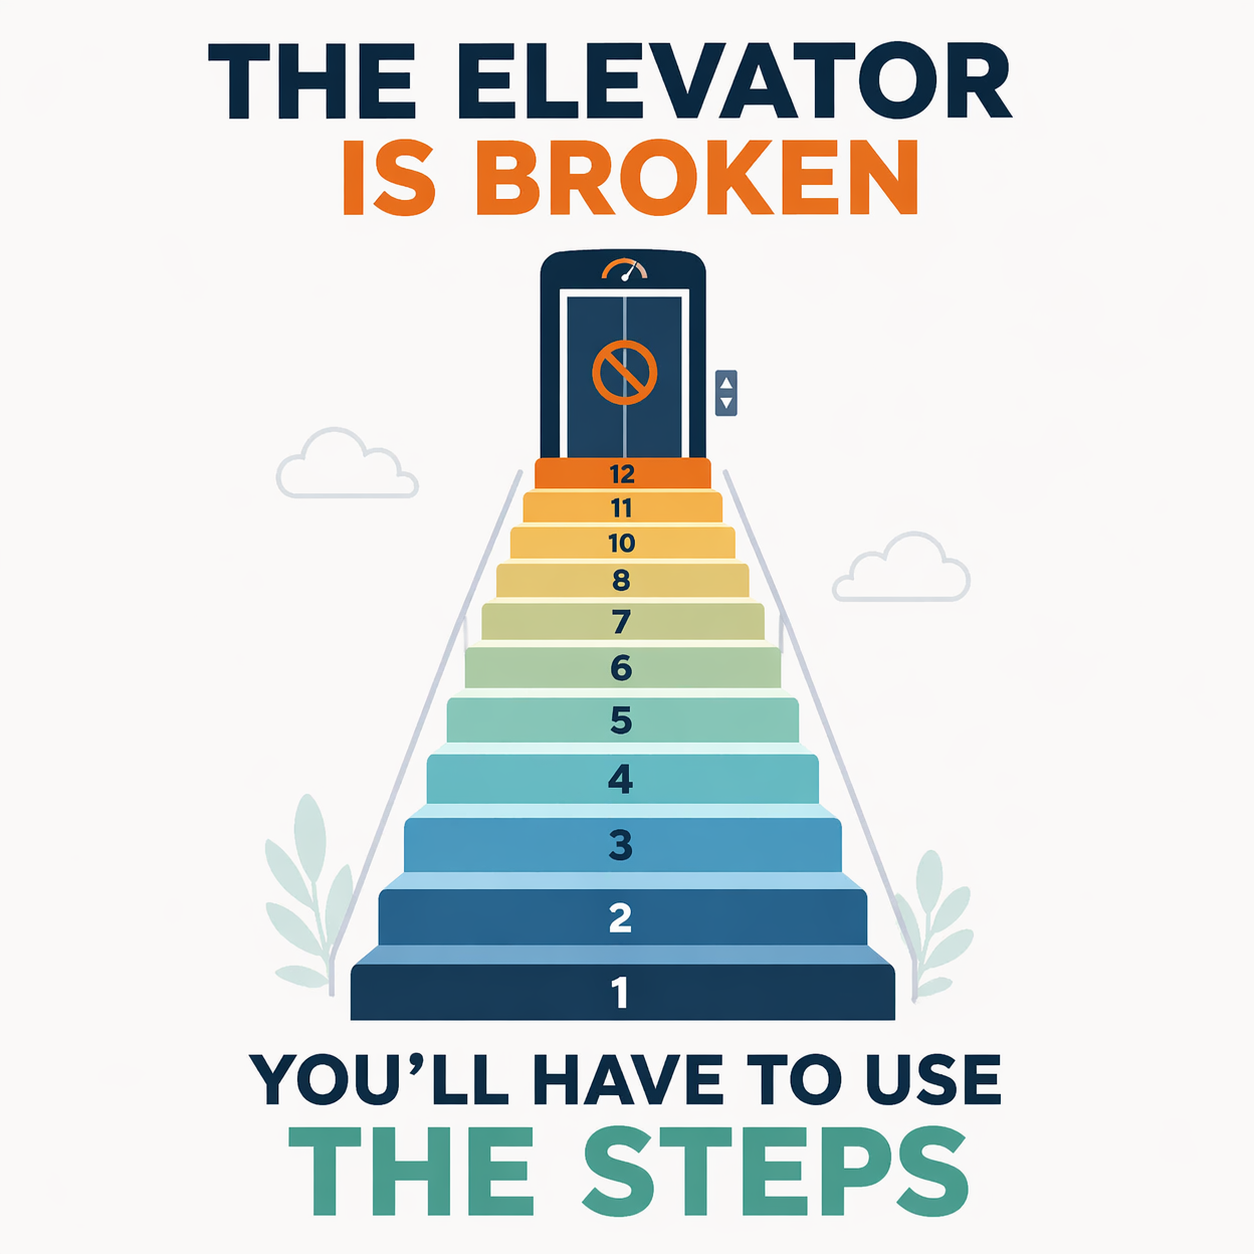
The big-bang transformation model is effectively dead:
Organisations that watched multi-year waterfall programmes collapse under their own weight are not going back. Gartner’s research shows that 85% of transformation initiatives fail to scale beyond the pilot stage, a direct consequence of programmes designed to deliver value at the end of a long runway rather than in visible, measurable stages. The demand in 2026 is for phased, iterative delivery with defined outcomes at each step.
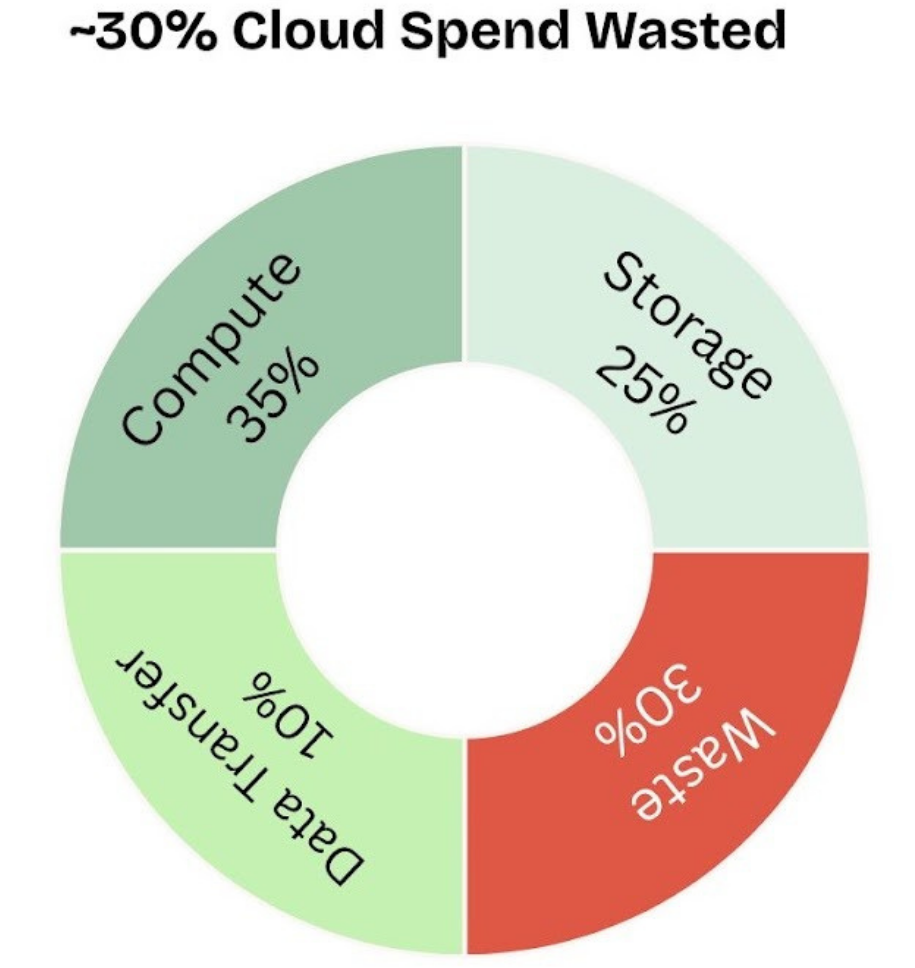
Cloud governance has replaced cloud migration as the challenge:
Most enterprises have already moved infrastructure to the cloud. The current problem is governance, cost optimisation, and making those investments actually perform. Partners still pitching cloud migration as a transformation milestone are addressing a problem most of their clients have already solved.
The "AI consultant" problem is real and growing:
The number of firms claiming AI expertise has grown far faster than the number with genuine delivery experience. A firm that has built and deployed AI systems in production looks identical in a proposal to one that has not. BCG found that successful AI transformations allocate 70% of their effort to people, process, and culture, not technology implementation. Partners who lead with tools rather than that broader context are selling the smaller part of the problem.
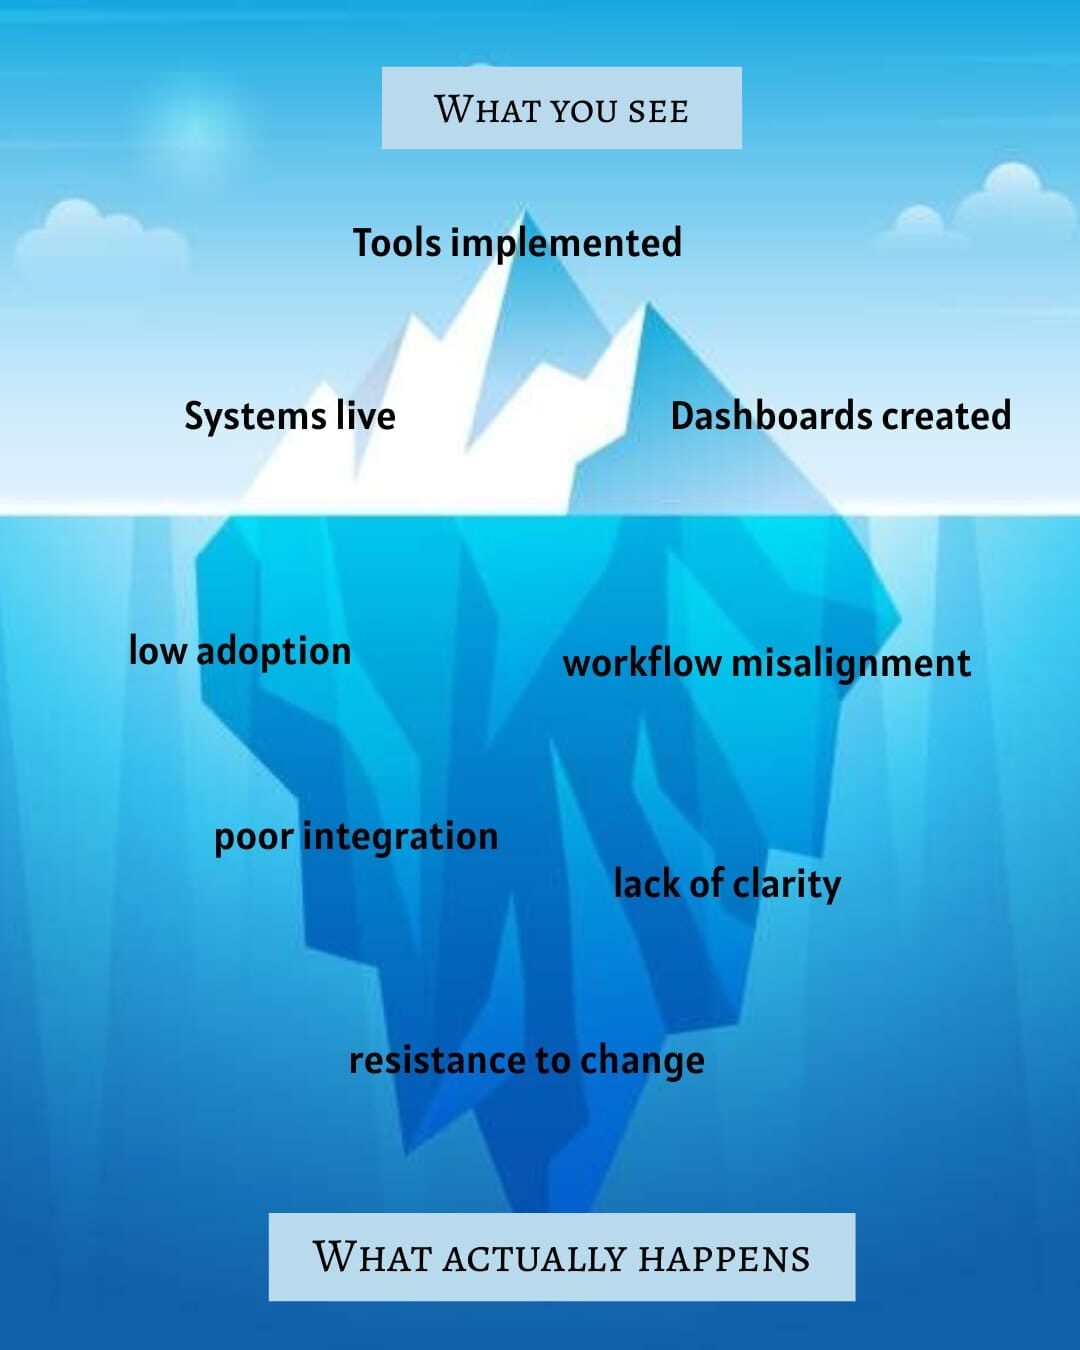
The Human Side of Why Transformations Fail
Technology gets blamed most often when a transformation fails. The platform wasn’t right. The integration broke. The data wasn’t clean enough.
Sometimes that’s true. But more often, the real reason is harder to name.
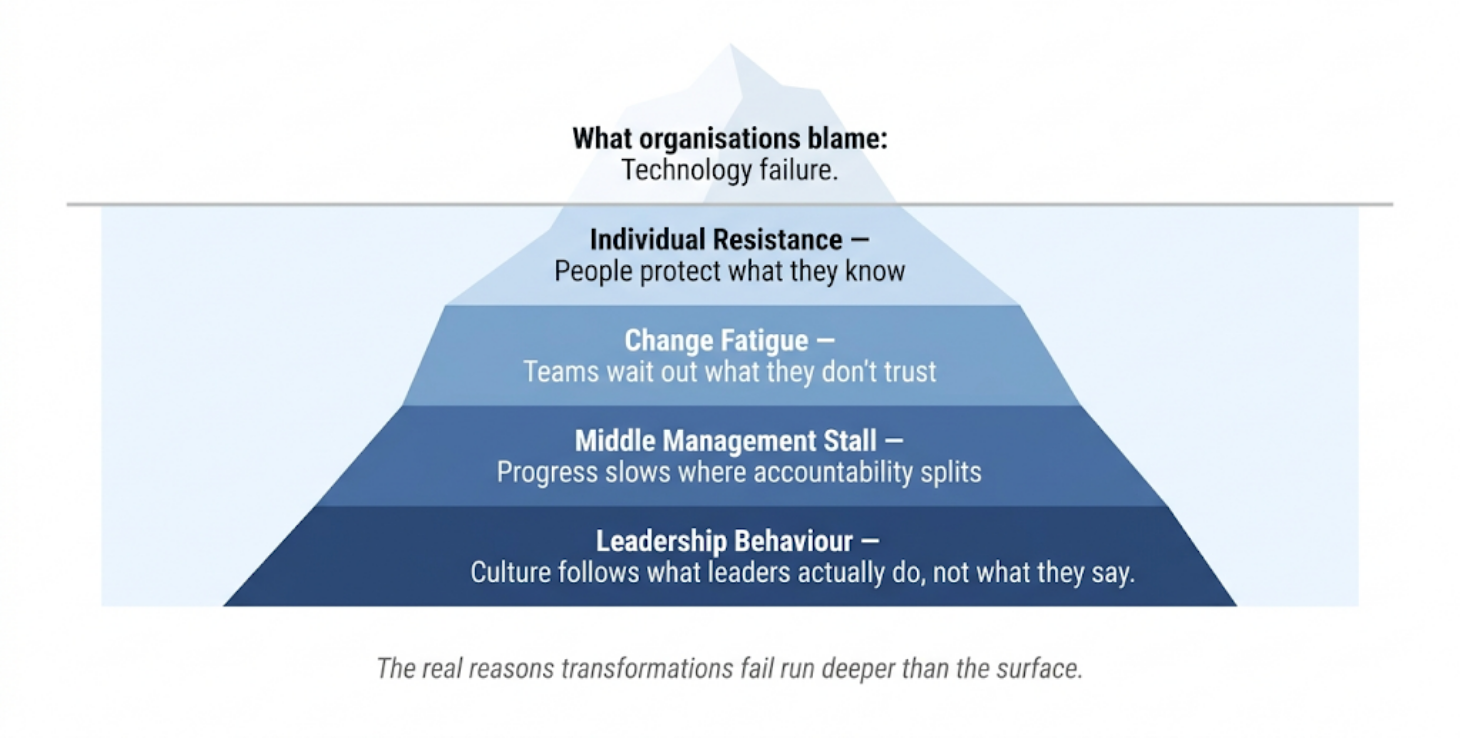
People don't change how they work just because a new system exists:
Prosci’s global research shows that projects with excellent change management are seven times more likely to meet their objectives than those with poor change management. Seven times. That’s not a marginal difference, it’s the difference between a transformation that takes hold and one that quietly dies after go-live. And yet, for most organisations, change management is still an afterthought: a communications plan sent out a week before launch, or a training session scheduled for the same day as go-live.
Organisational behaviour research is consistent on why this happens. When people perceive a new system as a threat to their autonomy, their expertise, or their sense of competence, resistance follows, even when the system is objectively better. McKinsey identifies cultural resistance and change management failures as the dominant obstacles to transformation success, consistently ranking above technology or budget as the primary causes of failure.
Change fatigue compounds everything:
Many organisations in 2026 have already been through one or two failed transformation attempts. Their teams have learned to wait it out, go through the motions of adoption while holding on to the old way until the initiative loses momentum. A partner who doesn’t recognise this pattern, and actively works against it, will produce the same outcome again.
Middle management is where transformations die most often:
Senior leadership sponsors the initiative. Frontline teams eventually adapt. But middle managers, responsible for both current results and absorbing the disruption of change, are where progress stalls. They neither fully commit to the new way nor openly resist it. They simply slow it down. A partner without a specific, practical approach to middle management alignment is missing the layer where most transformations actually break.
Leadership behaviour sets the ceiling:
If senior leaders say the right things but continue making decisions the old way, relying on gut feel, bypassing new systems, the organisation reads that signal immediately. Culture follows what leadership actually does, not what it says. The best transformation partners name this dynamic directly, even when it’s uncomfortable to do so.
For a deeper look at where transformation programmes typically break down, Axxonet’s article Why Most Digital Transformation Efforts Fail maps the patterns in detail.
What Actually Matters When Evaluating a Partner
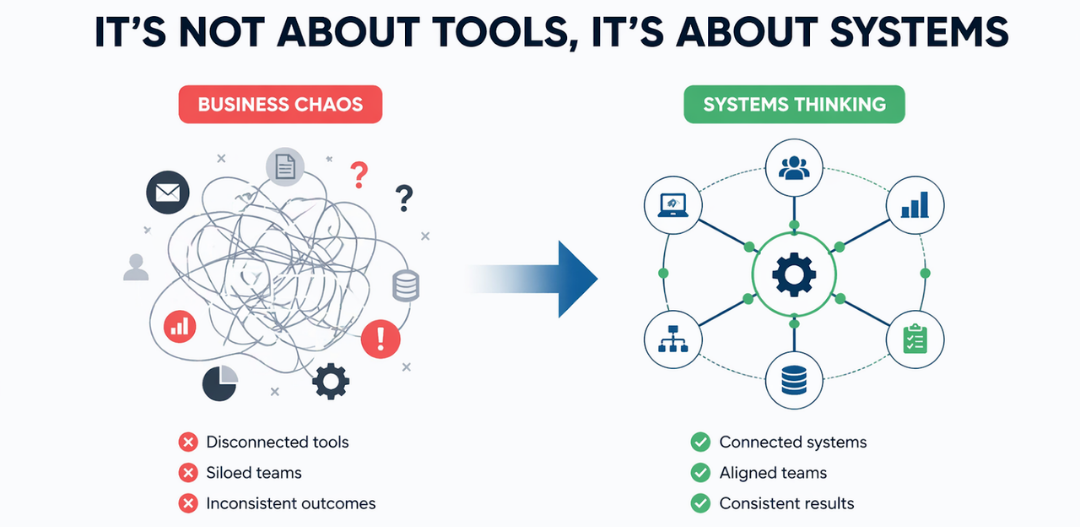
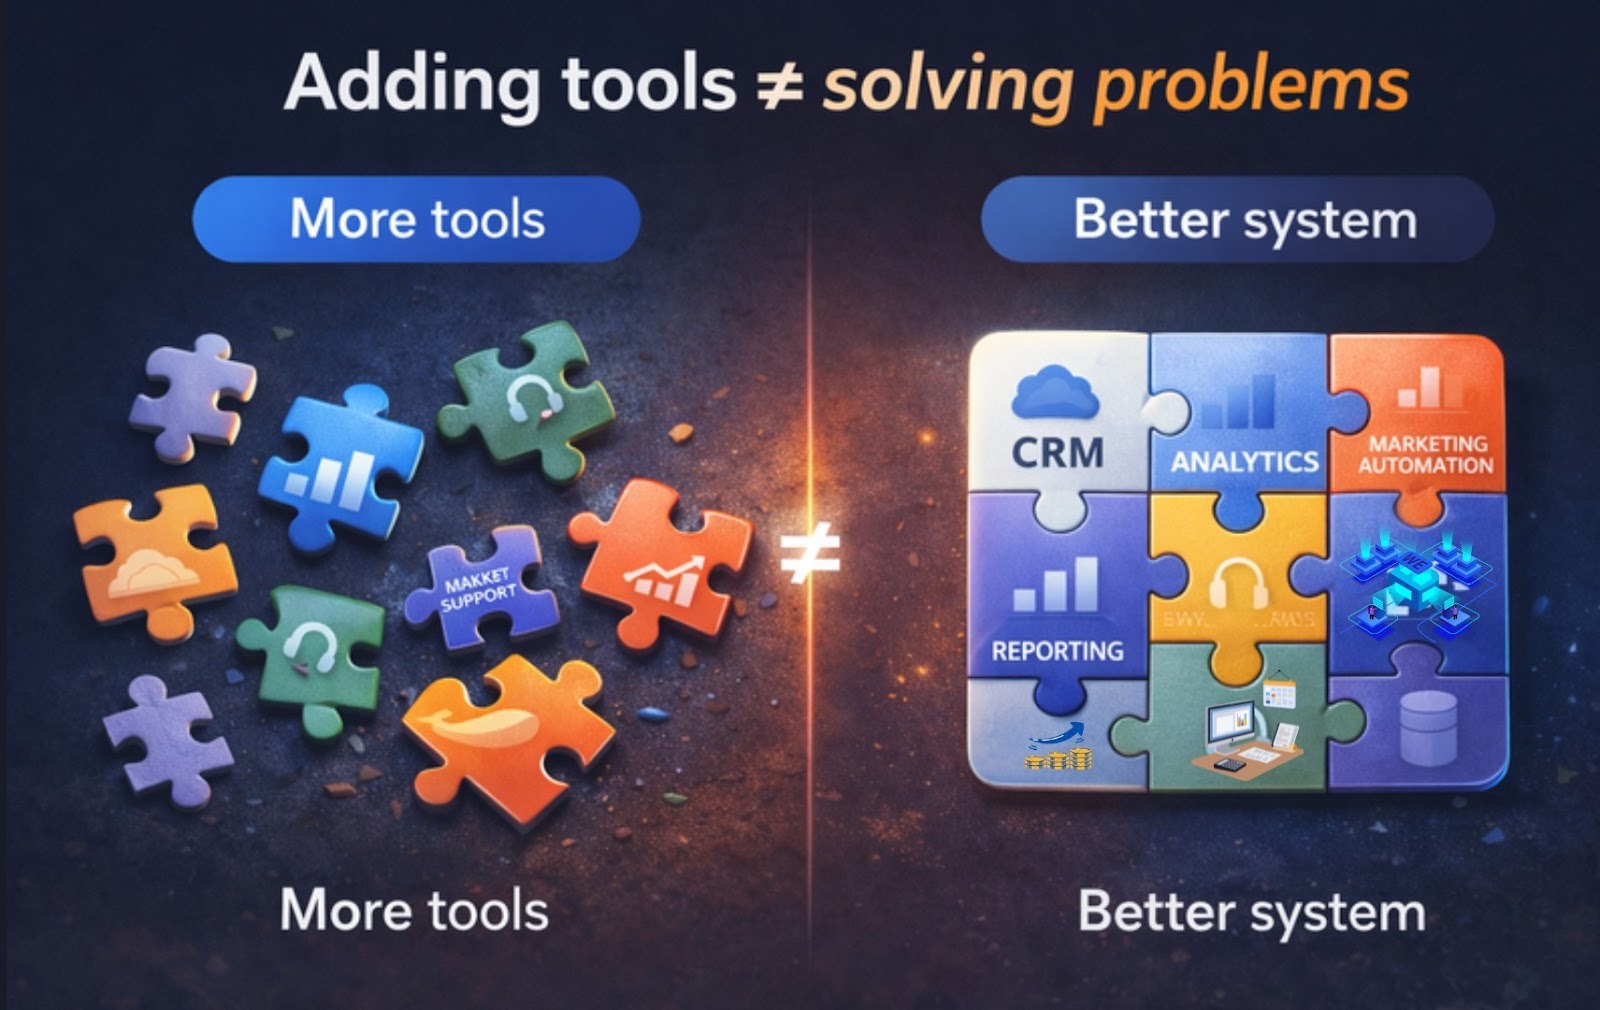
The shift happening across the industry is clear: organisations are moving away from advisory-only firms toward partners who combine strategy with execution, who can think through the problem and build the solution, manage the rollout, and stay accountable for outcomes. When strategy and execution sit with different parties, the gap between them is exactly where transformation breaks down.
These are the criteria that predict whether an engagement actually works.
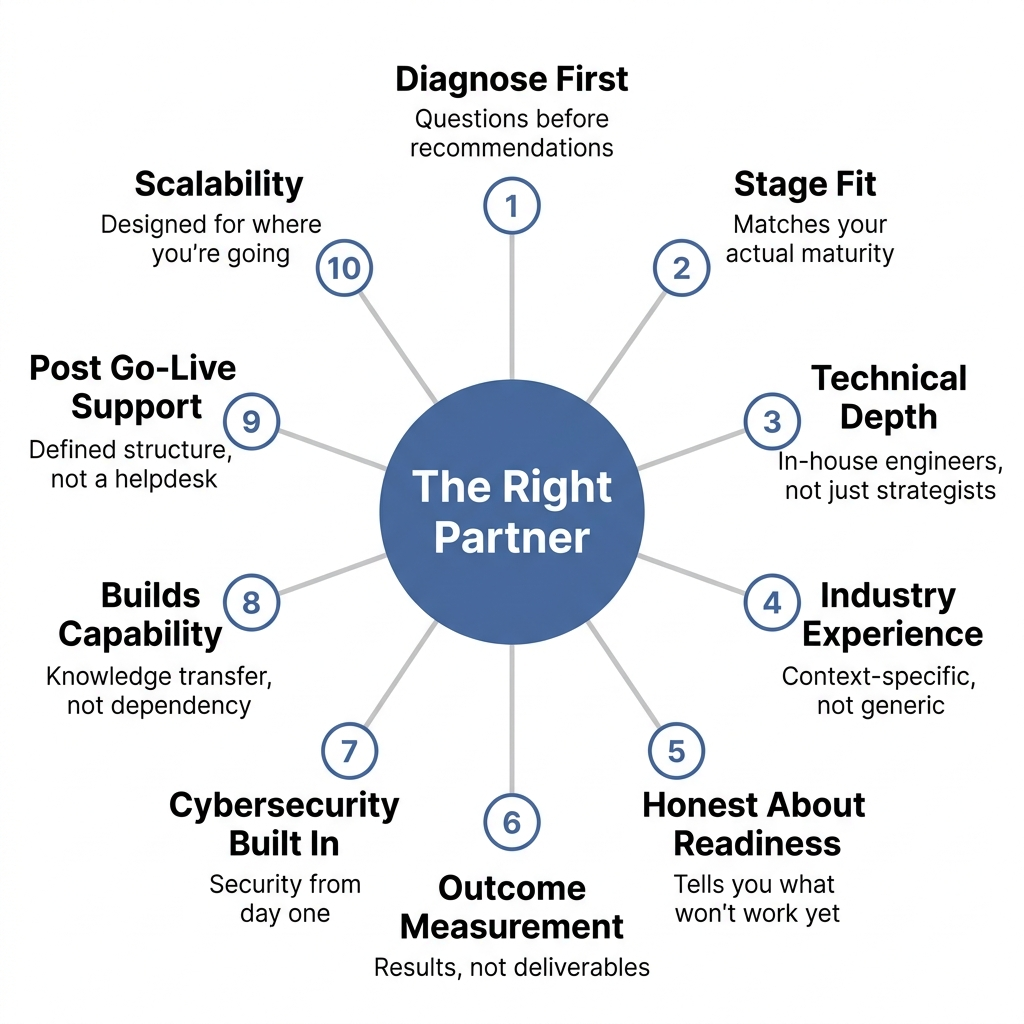
1. They diagnose before they prescribe
The first conversation should be heavy on questions. What does your current workflow look like? Where are decision-making bottlenecks? What’s already been tried and what broke? If the first meeting is a product demo, the partner has already decided what you need before understanding what you have, and that pattern will continue throughout the engagement.
Ask them: “How do you assess where we are before recommending anything?”
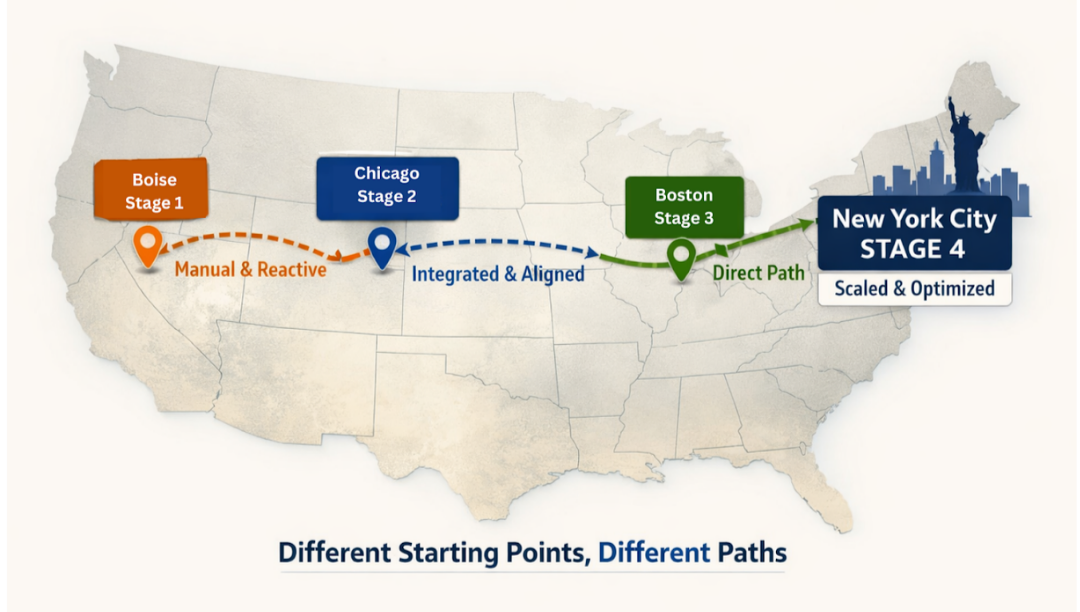
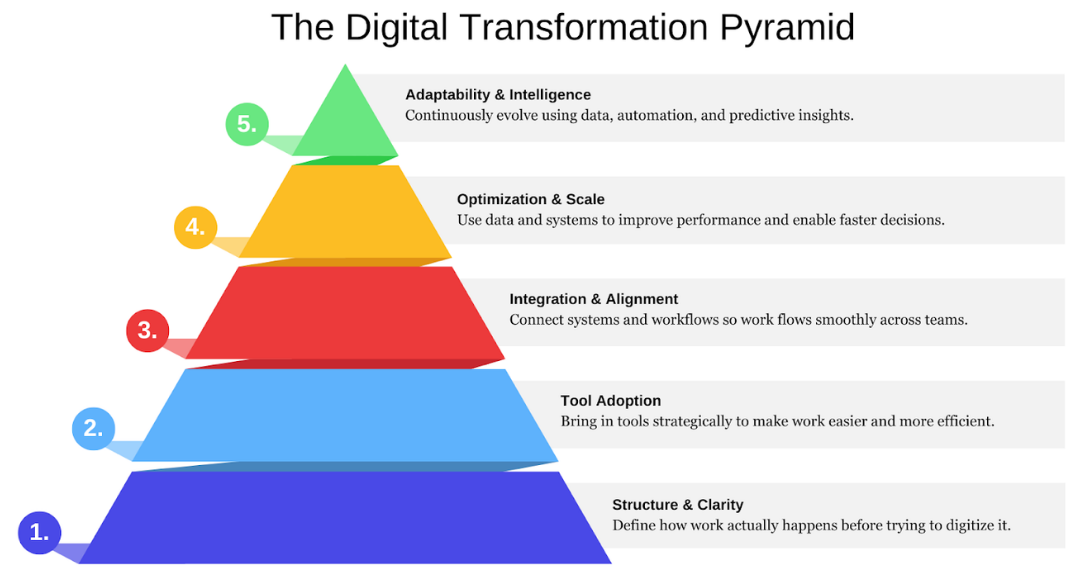
2. They work at your stage, not an idealised version of it
A Stage 1 organisation with manual processes and disconnected systems needs fundamentally different support than a Stage 3 organisation with connected infrastructure and an active analytics layer. McKinsey found that when the business case for transformation is developed by genuine subject-matter experts who understand the organisation’s actual state, 47% of transformations succeed. When it isn’t, that figure drops to 18%. A partner who applies the same framework regardless of starting point will give you a plan that sounds right but doesn’t fit.
Not sure what stage your organisation is at? AVIA’s Digital Transformation Maturity Audit walks through a practical self-assessment.
Ask them: “What would you do differently for an organisation at our current maturity versus one further along?”
3. They have genuine technical depth, not just strategy
Strategy without implementation is just documentation. The question isn’t whether the partner can produce a roadmap, it’s whether they can build what’s on it. Do they have engineers and architects in-house? Can they sit with your technical team and work through an integration problem directly? Or does delivery get subcontracted while the consulting firm manages from a distance? That gap is where intent and outcome diverge.
Ask them: “Who will be doing the hands-on work day-to-day, and what is their background?”
4. They have experience relevant to your context
Generic transformation advice breaks down at the detail level. A partner who has worked in healthcare understands compliance constraints and what change management means when the people being asked to change are clinicians. A partner with manufacturing experience understands operational rhythms and legacy system constraints. That contextual knowledge doesn’t appear in a proposal, it surfaces in how they ask questions and what they notice.
Ask them: “Can you walk us through an engagement in our industry and what was specific about how you approached it?”
5. They’re honest about what you’re not ready for
The best partners tell you things you don’t want to hear. “Your data isn’t clean enough for this yet.” “The problem isn’t the tool, it’s the adoption of what you already have.” “You’re trying to move too fast given where your team actually is.” A partner optimising for a signed contract won’t say these things. A partner optimising for a successful outcome will. If every conversation is a green light, be sceptical.
Axxonet’s article on Why Digital Transformation Feels Expensive is direct about the cost of skipping this honesty, and how to approach transformation without over-engineering it.
Ask them: “What have you told a client they weren’t ready for?”
6. They measure outcomes, not outputs
A consulting firm can produce an enormous number of deliverables, roadmaps, architecture documents, process maps, training decks, without producing any business results. Ask how they define success. Ask for examples where they can point to a specific business outcome, reduced operational cost, improved cycle time, measurable adoption rates, not a completed milestone. If success is defined as “delivery of the roadmap” rather than “what changed because of it,” that’s the wrong frame.
Ask them: “How do you measure whether this engagement has succeeded, and can you show me an example?”
7. They treat cybersecurity as part of transformation, not separate from it
In 2026, security and transformation have converged. Every system integration creates new attack surfaces. Every cloud workflow introduces access control questions. Every AI system touches data that needs governance. Gartner’s 2026 analysis highlights preemptive cybersecurity and confidential computing as among the top enterprise priorities, not as standalone concerns, but as structural elements of how modern systems are built. A partner who treats security as a compliance checkbox at the end is creating risk that will surface later, at the worst possible time.
Ask them: “How do you handle security and compliance as part of the transformation, not as a separate workstream at the end?”
8. They build capability, not dependency
A good partner’s goal is to eventually not be needed. They should be transferring knowledge throughout the engagement, training your team on the systems being built, documenting decisions so the reasoning stays internal, and building capability that outlasts the contract. Prosci’s research shows that organisations which measure adoption and build internal change capability are up to five times more likely to meet or exceed their transformation objectives. If the relationship structure makes your organisation more dependent over time, not less, that’s a problem.
Ask them: “What will our team be able to do independently at the end of this engagement that they can’t do today?”
9. Their post-go-live support is real
Implementation is not the finish line. Systems break in production in ways they didn’t in testing. Teams need retraining when turnover happens. Use cases evolve. Ask specifically what post-implementation support looks like structurally, not the general answer, but the actual structure. Who is the contact? What’s the response time? Is there a dedicated resource or a general helpdesk? The answer tells you whether the partner views the relationship as ongoing or complete at launch.
Ask them: “What does post-implementation support look like specifically not in general terms, but structurally?”
10. They can scale with you
A partner who executes well at your current size is valuable. A partner who can still execute when you’ve grown, across teams, geographies, or infrastructure layers, is rarer. BCG notes that 75% of digital transformations fail to deliver expected value partly because architectures aren’t designed for the organisation’s actual growth trajectory. Ask whether the systems being built account for where you’re going, not just where you are today.
Ask them: “Have you worked with organisations at a larger scale than ours, and how does your approach change as complexity grows?”
Red Flags in the Sales Process Itself
The criteria above help you evaluate capability. These signals tell you something is wrong before you’ve even finished the proposal stage in the room, in the conversation, in how they behave when they’re trying to win your business.
- They answer every question with a case study. Deflecting to “here’s what we did for a client” rather than engaging with your specific situation is a pattern. It means they’re more comfortable with their playbook than with your problem.
- The engagement scope grows in every conversation. If each meeting adds something new to the proposal without a corresponding reduction elsewhere, you’re seeing how the engagement will be managed, scope creep starts in the sales process.
- They can’t describe a failure. Every experienced partner has been through engagements that didn’t go to plan. A partner who can’t or won’t talk about one, specifically, and with honest reflection hasn’t processed it or isn’t willing to be transparent with you.
- Change management appears only in the final slide. If the proposal’s change management section is one slide with a communications timeline, that’s the depth they’ll bring to it throughout.
- The pricing is suspiciously vague until you’re already committed. Partners who are unclear on commercial structure during the sales process are often unclear on scope during delivery.
- They haven’t asked what’s been tried before. A partner who doesn’t ask about previous transformation attempts, what happened, what broke, what the team now believes, is walking in blind and doesn’t know it.
What to Look For | Green Flag | Red Flag |
Discovery process | Diagnosis before prescription | Product demo in the first meeting |
Delivery team | In-house engineers and architects | Subcontracted delivery |
Success definition | Specific business outcomes | Deliverable completion |
Stage fit | Approach varies by maturity | Same playbook for everyone |
Honesty | Tells you what you’re not ready for | Every conversation is a green light |
Human behaviour | Change management built in from day one | One slide, end of proposal |
Cybersecurity | Integrated into architecture from the start | Compliance checkbox at the end |
Scalability | Designed for where you’re going | Optimised only for current state |
Execution model | Strategy + build + rollout, one team | Strategy handed off to a separate implementer |
Post-go-live | Defined support structure | General helpdesk only |
Knowledge transfer | Builds internal capability | Creates long-term dependency |
Conclusion
The market is full of firms that are good at selling digital transformation. Fewer are good at delivering it, and fewer still are willing to tell you what you’re not ready for.
The right partner in 2026 starts with your reality: your stage, your systems, your team’s capacity for change. Not a generic playbook. Not what worked for a different client in a different context.
That’s the standard to hold any partner to. Use the criteria and questions in this article in your next evaluation conversation. The partner worth working with won’t be rattled by them, they’ll already be thinking about these things.
If you'd like to see how Axxonet approaches this in practice, the diagnosis process, the delivery model, and what an honest first conversation looks like,
No deck. No pitch. Just a clear look at where you are and what would actually move things forward.
Frequently Asked Questions
It varies enormously by scope, duration, and firm type. Higher cost doesn't reliably predict better outcomes; a boutique with deep domain experience will often outperform a larger firm using a standardised methodology. A more useful frame than total budget is value per phase: what specific outcome are you paying for at each stage, and how will you know if it's been achieved?
A well-structured engagement should produce visible outcomes within the first 60–90 days, not at the end of a multi-year programme. If a partner positions value delivery as something that happens only after a long runway, that structure is worth questioning. Meaningful early results also help build internal confidence for later phases.
Size matters less than fit. Large firms bring scale and breadth; specialised boutiques bring depth and agility. For many mid-sized organisations, a boutique with specific domain experience and in-house delivery capability will outperform a large firm applying a generic framework. The better question is: “Have they solved problems like ours before?”
A systems integrator focuses primarily on implementing and connecting platforms. A digital transformation consultant addresses the broader operational change, including workflow redesign, adoption, governance, and business outcomes. The strongest engagements combine both capabilities rather than treating them separately.
Involve internal stakeholders in defining the problem before a partner is selected. People support what they helped shape. If transformation decisions are made entirely at leadership level and handed down without involvement, resistance usually increases significantly during implementation.
Be transparent about it with prospective partners. A strong partner will want to understand not only the technical issues, but also the organisational dynamics, adoption challenges, and leadership gaps that contributed to the failure. Previous failed initiatives create change fatigue that must be accounted for early in the engagement.
Cybersecurity is now a core part of transformation architecture rather than a separate compliance activity. Every integration, cloud workflow, automation layer, and AI deployment creates additional operational risk. Modern transformation partners should incorporate governance, resilience, compliance, and security planning from the earliest stages of implementation.
AVIA’s Digital Transformation Maturity Audit helps organisations evaluate where they currently stand across systems, workflows, operational efficiency, analytics capability, and digital adoption. Instead of relying on assumptions, the audit provides a structured view of current maturity and highlights the most practical next steps for improvement.
Yes. One of AVIA’s primary goals is helping organisations identify inefficiencies, disconnected workflows, reporting gaps, and infrastructure limitations before large-scale implementation begins. This allows businesses to prioritise the highest-impact improvements first rather than over-investing in technology that may not address the underlying operational issue.
Axxonet combines strategy with hands-on execution. Rather than stopping at roadmap delivery, engagements include technical implementation, systems integration, operational rollout, adoption support, and measurable outcome tracking. The focus is not just on recommending transformation, but on making it operationally successful inside real business environments.